
Excel Spreadsheets CPE: What Accountants Actually Need to Know

A client asked me once why a number in their financial report didn't match the source data. It took three hours to find the answer: a VLOOKUP that had silently returned the wrong value for months. Nobody caught it because it looked right. That's the thing about spreadsheet errors — they don't announce themselves. If you've ever felt that particular stomach-drop moment, you already know why deliberately building your Excel skills isn't optional anymore.
Why Excel Skills Matter More Than Ever for CPAs and Finance Teams
The risk isn't just that errors happen. It's that they hide. A formula that returns a plausible number doesn't trigger a review, and by the time someone traces it back, the bad figure has already appeared in a board report, a tax return, or a client deliverable. Manual, hand-built spreadsheets create that exposure at every step — and the more complex the workbook, the more places a mistake can live quietly.
Client expectations have shifted, and they haven't shifted back. Stakeholders want reports that are visual, dynamic, and fast. A static table emailed as a PDF used to be acceptable. Now it reads as a sign that your process hasn't kept up. The firms and practitioners who've moved to pivot tables, dynamic arrays, and automated reporting pipelines aren't just working faster — they're setting the benchmark everyone else gets measured against.
Then there's the AI layer. Copilot is built into Microsoft 365. Python now runs directly inside Excel cells. These aren't future capabilities — they're in the version your clients are probably already using. Accountants who haven't spent time with these tools face a real credibility gap when a colleague pulls up an AI-assisted analysis in a meeting and you're still explaining a VLOOKUP. That gap is visible, and it grows the longer you wait.
What that means practically is that Excel for accountants now covers a lot of ground: formulas and functions, yes, but also automation through Tables and Power Query, advanced reporting through pivot tables and dynamic arrays, and AI-assisted analysis that requires its own verification discipline. Each of those layers takes deliberate effort to build. You don't absorb Power Query by accident.
That's where CPE requirements become genuinely useful rather than just obligatory. A structured, credit-earning course gives you a reason to sit down and build those skills systematically instead of picking up fragments whenever a deadline forces it. Piecemeal learning produces piecemeal results — and in a client deliverable, piecemeal is exactly the wrong word.
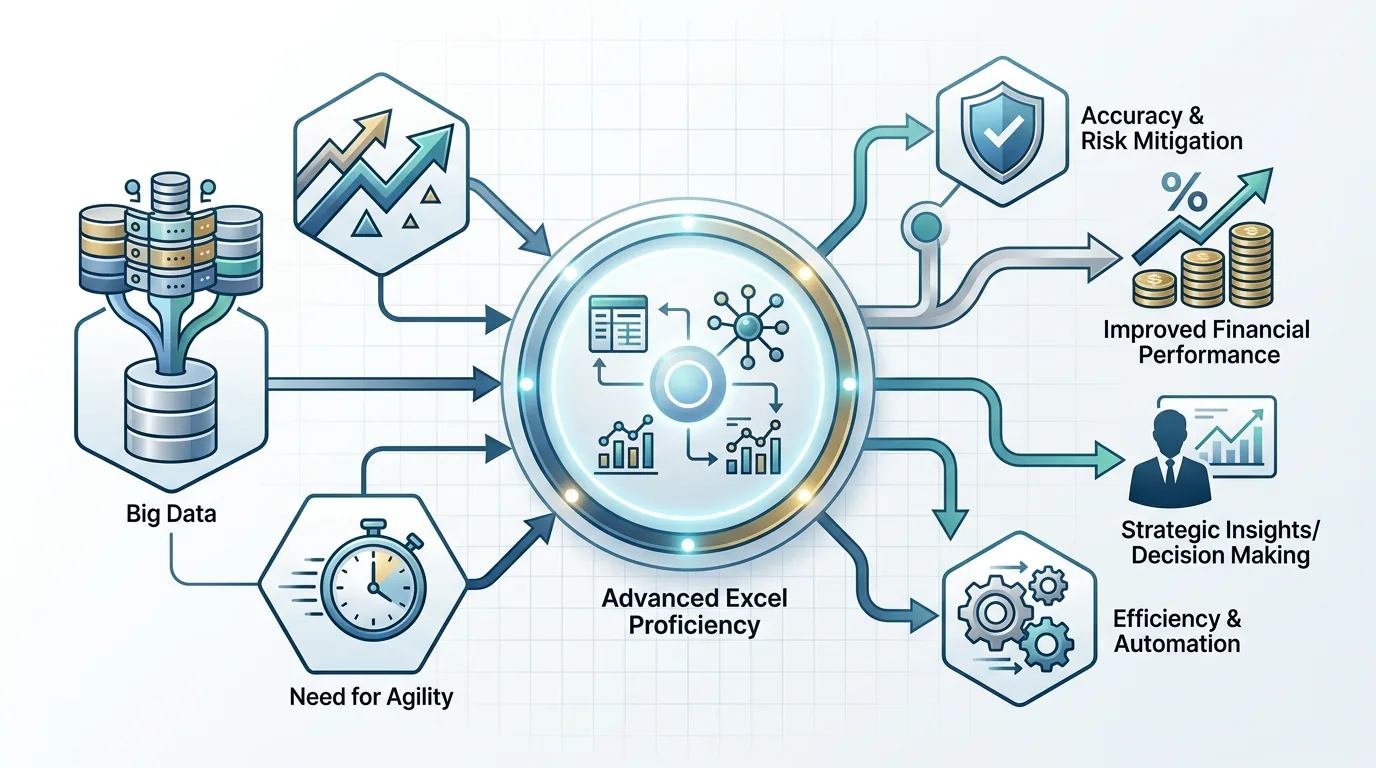
What 'Excel Spreadsheets CPE' Actually Covers
Think of Excel CPE for accountants as a curriculum organized in three distinct layers, each one building on the last rather than repeating it.
The foundational layer is formulas. Not just any formulas — the ones that do the actual heavy lifting in accounting work. VLOOKUP is still alive in most firms, but XLOOKUP handles the cases VLOOKUP can't, and dynamic arrays let a single formula do what used to require a column of copied-down calculations. Add logical functions to that stack and you're automating calculations that accountants once built by hand, one cell at a time. That's not a convenience — it's an error-reduction strategy.
Pivot tables sit at the center of the reporting layer. These courses treat them as a reporting discipline, not a shortcut. You'll learn to create dynamic reports, apply advanced calculations inside the pivot itself, and design data visualizations that help a stakeholder actually make a decision. A pivot table that just reorganizes numbers isn't the goal; one that communicates something is.
Automation is its own layer, and it's worth treating it separately. Excel Tables and Power Query work together to extract, transform, and load data from multiple sources with minimal manual effort. What used to be a multi-hour cleanup job — reformatting exports, reconciling column headers, removing duplicates — becomes a repeatable process you run in minutes. That's where the real time savings compound.
At the intermediate level, the curriculum moves into AI integration. That means Copilot's actual capabilities inside Excel — not the marketing version, but what it genuinely does for data preparation and summarization — and Python running directly inside Excel cells for statistical analysis that goes well beyond standard spreadsheet functions. Because AI tools make mistakes, these courses also cover verification: auditing AI-generated formulas, and knowing which scenarios call for automation versus which ones require a human to stay in the loop.
The through-line across all of it is practical application. Every topic is framed around real accounting and reporting workflows, not abstract software features. You're not learning Excel in the abstract — you're learning it the way accountants actually use it.
Key Things to Get Right When Building Excel Skills for Accounting Work
Start with lookup functions. Not because they're glamorous, but because they're everywhere in accounting environments and they fail quietly. VLOOKUP is still embedded in workbooks across most firms, and it'll be there for years. But it has a hard structural limitation: it can only look to the right. XLOOKUP doesn't have that constraint, and it handles approximate matches, reverse lookups, and missing values in ways that VLOOKUP simply can't. Knowing which one to reach for — and understanding why the choice matters — is what keeps a silent wrong-value error from surviving a review cycle.
Pivot tables deserve the same seriousness you'd give a reporting methodology. There's a real difference between a pivot table that reorganizes numbers and one that communicates something a stakeholder can act on. That difference lives in the advanced calculations, the layout decisions, and the visualization choices — the craft layer that most people skip because they learned pivot tables informally. These courses treat that craft as a discipline worth studying, and that framing is exactly right.
Power Query should be learned as a system, not pulled out when you have a one-time cleanup job. The real payoff comes when you connect Tables and Power Query together into a data model that refreshes automatically. That's not a time-saver — it's reporting infrastructure. One refresh cycle and the numbers are current. Build it once, trust it repeatedly.
When Copilot or Python-in-Excel enters your workflow, the human-in-the-loop discipline isn't optional. AI-generated formulas and scripts can look completely correct and still be wrong in ways that matter. Audit them. The intermediate course spends significant time on exactly this — verification strategies, not just usage instructions.
And know when to put the automation tools down. Determining which scenarios call for AI versus a traditional manual approach is increasingly a professional judgment, not a preference. That judgment protects data integrity.
One more thing that's easy to overlook: text, date, and lookup formulas aren't separate skill sets. Combining them — calculating accrued interest based on elapsed days, or building a dynamic label that pulls from a lookup — is where a lot of intermediate-level efficiency actually lives. Treat them as a vocabulary you mix, not a menu you pick from one item at a time.
How Excel Spreadsheets Courses Earn CPE Credit
Every course in this lineup is built as a formal continuing education program, not a tutorial series repurposed for credit. That distinction matters. Each one carries defined learning objectives and structured major topics — the architecture that state boards and CPE sponsors require before a course qualifies for professional credit. You're not watching someone walk through menus; you're working through a curriculum designed around demonstrable outcomes.
The two foundational courses — formulas and pivot tables, and Tables with Power Query — are classified at the basic level. That's a deliberate choice. A lot of CPAs have picked up Excel skills informally over the years, learning what they needed for a specific job and moving on. These courses give you a structured way to formalize that knowledge, fill the gaps you didn't know were there, and document it. No prerequisites required.
The AI integration course sits at the intermediate level, which reflects what it actually asks of you. If you're already comfortable in Excel and want to extend into Copilot and Python-in-Excel, that's the right entry point. Coming in without a working foundation in the tool would make the verification and auditing material harder to apply, and applying it is the point.
On credit categories: Excel and technology skills may qualify for continuing education credit under a technology or computer science category, but the specific classification depends entirely on your state board's rules. Credit field designations vary by jurisdiction, and some boards are more granular than others. Always verify with your licensing authority before you register if that classification matters for your cycle.
The format of these courses — skills-based, focused on things you can actually construct and audit — fits the applied-learning model that many CPE frameworks recognize. Completing them gives you something concrete to point to: documented professional development in a technical area that shows up in peer reviews, in client engagements, and increasingly in conversations about how your team handles data.
Where to Go Deeper: Excel CPE Courses Worth Your Time
Three courses cover the full range of what accounting professionals actually need, and they're sequenced so you can enter at the right level rather than sitting through material you've already mastered.
Excel Accounting Tools: Most Useful Formulas and Pivot Tables is the right first stop if your current workflow still relies on formulas you learned by copying someone else's workbook. It's a basic-level course that works through VLOOKUP and XLOOKUP side by side, covers dynamic arrays, and builds into logical functions that automate calculations you're probably still doing by hand. The pivot table section goes further than setup — it covers advanced calculations inside the pivot itself and the visualization decisions that make a report useful to someone who has to act on it. If you've been meaning to formalize skills you picked up informally over the years, this is the structured version of that.
Easy Excel Automation with Tables and Power Query is also basic level, but it covers a different problem entirely. This one is for professionals who spend real time every week cleaning and reformatting data before they can even start the analysis. Excel Tables and Power Query are treated here as a connected system — not two separate features you learn independently. The course walks through how to build data models that update automatically when the source data changes, which is where the time savings actually compound. If you regularly pull data from multiple sources and stitch it together manually, this course addresses that workflow directly.
Excel + AI: A Powerhouse Combo is intermediate level and earns that designation. It covers what Copilot actually does inside Excel — not the marketing version, the practical one — and introduces Python running directly in Excel cells for statistical analysis that standard spreadsheet functions can't handle. A significant portion of the course is devoted to verification: how to audit AI-generated formulas before they go anywhere near a client deliverable, and how to decide when AI assistance is appropriate versus when you need to keep a human hand on the work. That judgment is increasingly a professional competency, not just a best practice.
All three courses are built specifically for accounting and finance professionals. The examples stay grounded in the work CPAs actually do — financial reporting, data cleanup, client deliverables — rather than generic business scenarios that you have to translate back to your own context.
If you're not sure which course fits your current CPE cycle, browse the full Excel courses catalog to see the complete lineup by level and topic.
Frequently Asked Questions
What is Excel spreadsheets in accounting?
In accounting, Excel spreadsheets are the primary tool for building financial models, preparing reports, reconciling accounts, and analyzing data. For CPAs and finance professionals, that means working with lookup functions like VLOOKUP and XLOOKUP, pivot tables for dynamic reporting, and automation tools like Power Query that pull and clean data from multiple sources. At the more advanced end, it now includes AI-assisted analysis through Copilot and Python running directly inside Excel cells.
How does Excel spreadsheets earn CPE credit?
Excel courses earn CPE credit when they're structured as formal continuing education programs with defined learning objectives and major topics — the architecture CPE sponsors and state boards require. The foundational courses covering formulas, pivot tables, and Power Query are classified at the basic level; the AI integration course is intermediate. Technology and computer science skills like these may qualify for continuing education credit depending on your state board's rules, so confirm the credit field classification with your specific licensing authority before enrolling.
What's the difference between the basic and intermediate Excel CPE courses?
The basic-level courses — formulas and pivot tables, and Tables with Power Query — are designed for accountants who want to formalize skills they've built informally or fill gaps they didn't know were there. No prerequisites required. The intermediate AI course assumes you're already comfortable in Excel and want to extend into Copilot for data preparation and Python-in-Excel for statistical analysis. It also covers how to audit AI-generated formulas before they go anywhere near a client deliverable, which is where the real professional risk lives.
Do I need to take the Excel CPE courses in order?
Not strictly, but the sequencing makes sense. The formulas and pivot tables course builds the foundation; the Tables and Power Query course adds the automation layer on top of it; the AI course assumes both are in place. If you're already confident with XLOOKUP and pivot tables, you can move straight to the automation course. If you're already automating with Power Query and want to add Copilot and Python, the intermediate course is the right next step. Enter at the level that reflects where you actually are.
What Excel spreadsheets CPE courses are available for CPAs?
Three courses cover the full range: Excel Accounting Tools: Most Useful Formulas and Pivot Tables (basic) focuses on VLOOKUP, XLOOKUP, dynamic arrays, and pivot table reporting; Easy Excel Automation with Tables and Power Query (basic) covers building automated data models and eliminating manual cleanup; and Excel + AI: A Powerhouse Combo (intermediate) addresses Copilot, Python-in-Excel, and the verification strategies that keep AI-assisted work accurate. All three are designed specifically for accounting and finance professionals, not general business users.
Test your knowledge
You're building a financial report and need a lookup that can search to the left, handle missing values gracefully, and return a result from a column that isn't to the right of your lookup column. Which function should you use?