


 Conference
Live Replay WebinarBasic level
Data and Statistical Analytics Using Microsoft Excel
The role of the financial professional has shifted from reporting on the past to predicting the future, yet many practitioners still rely on manual, static workflows that fail to capture the full story within their data. This course bridges the gap between traditional accounting and modern data science by utilizing Excel’s most powerful analytical engines to turn raw numbers into defensible business intelligence. We will move beyond simple averages, exploring how to use the Analysis ToolPak for deep statistical dives and leveraging Dynamic Arrays to build fluid, auto-updating models that respond to changing business conditions in real time. Participants will explore a modern analytics workflow that balances classic statistical rigor with cutting-edge efficiency. We will examine how to implement regression analysis for more accurate budgeting, utilize advanced forecasting functions to anticipate market shifts, and even leverage AI-assisted insights to find hidden patterns in sprawling datasets. By the end of this session, you will be able to distinguish between mere “data entry” and “data discovery,” providing your firm or organization with the high-level analysis required to navigate an increasingly complex economic landscape.
Ways to save
Save $18.34 with a credit pass
At the 40-Credit Pass rate ($22.22 a credit with the bonus), this 3-credit course comes to about $66.66: $18.34 less than buying it on its own.
Or start smaller: the 10-Credit Pass ($275.00) pays for it and leaves you 7 credits for more.
Year-end bonus: up to 5 free credits through Dec 31.
Certain conditions apply: not valid for the Federal Tax Update. Pass terms
Watch
 2:35
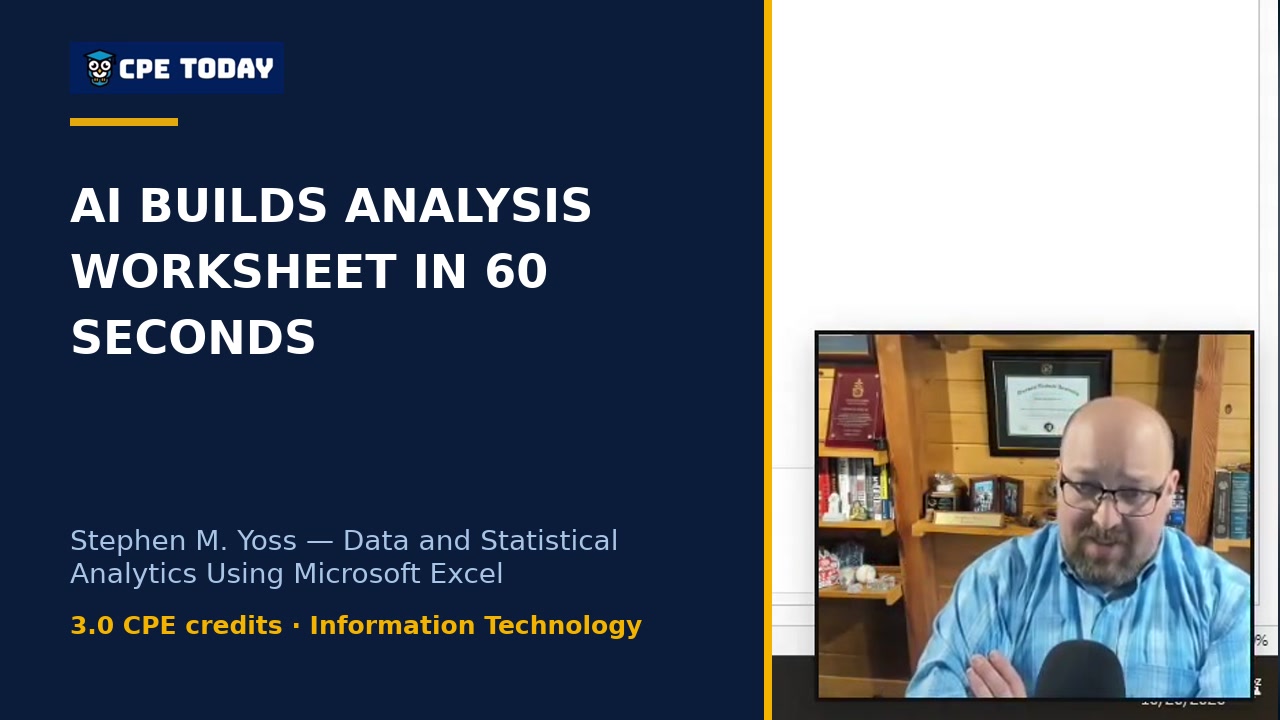
AI Creates a Full Analysis Worksheet in One MinuteWatch how AI tools integrated directly into Excel can autonomously analyze your sales data, create comprehensive summaries with forecasting, and generate pivot tables—all without manual formula writing. Stephen Yoss demonstrates this powerful workflow that's changing how professionals handle data analytics. See how you can leverage these tools to spend less time on routine analysis and more time on strategy.
 3:37
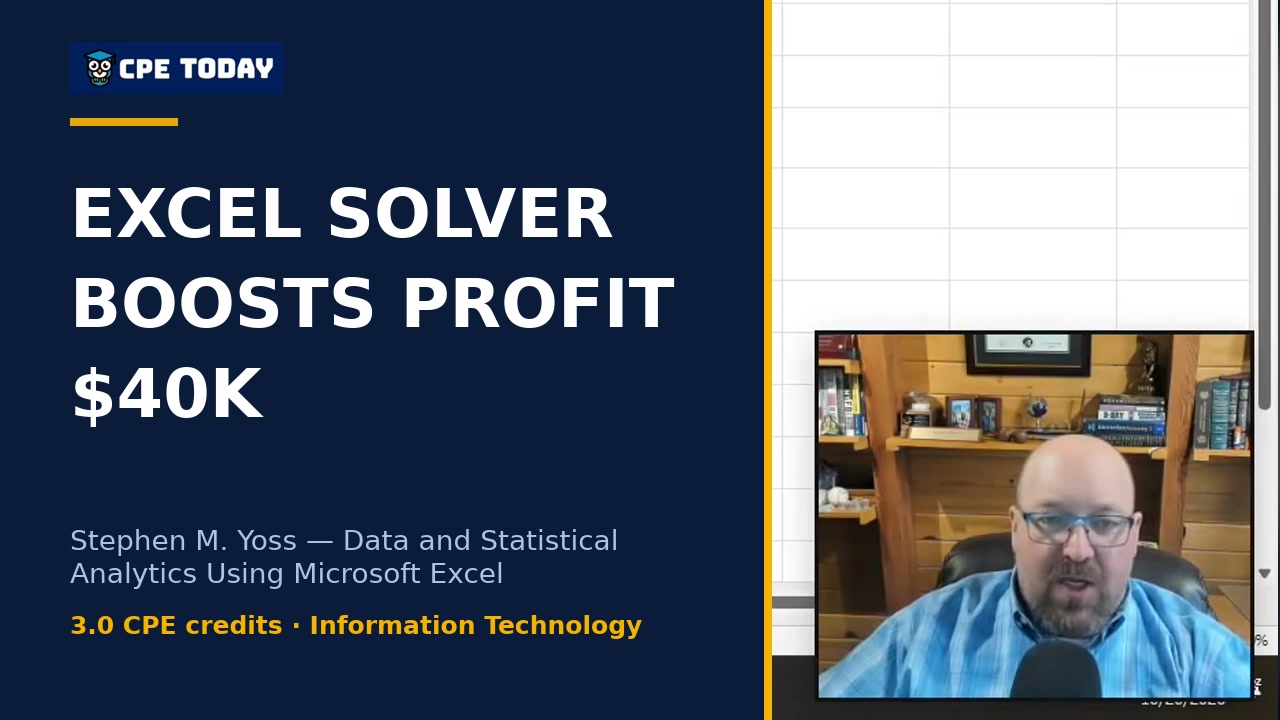
Solver: From Constraints to $40K Profit in SecondsSee how to use Excel Solver to optimize production decisions across multiple products. Stephen Yoss walks through a factory floor scenario where you need to balance three widgets, material costs, labor, and capacity limits to find the maximum gross profit. Learn how to set constraints and run multiple scenarios to model different pricing strategies and discover what your actual revenue potential is.
 1:38
The Silent Killer: Hard-Coded Values in Dynamic SheetsLearn why mixing data, averaging averages, and hard-coding values silently corrupt your analysis. Stephen Yoss walks through the mathematical and structural mistakes that undermine data integrity, plus the centralized assumptions approach that keeps your workbooks clean and auditable. Watch to master the foundational practices that separate reliable analytics from analysis built on hidden errors.
 2:10
Collect Data First, Figure Out Use LaterBefore you analyze anything, you need quality information. Stephen Yoss explains why data veracity matters, how much data you actually need, and why you should start collecting now—even when you don't know exactly how you'll use it yet. Watch what separates data leaders from everyone else in this practical lesson from his Excel analytics course.
What's included
Every registration comes with the course materials — yours to keep.
- Demonstration & sample files ZIP
- Additional course files PDF
Course details
- Recommended CPE credit
- 3
- Field of study
- Information Technology
- Program level
- Basic
- Delivery method
- Group Internet Based
- Prerequisites
- None
- Advance preparation
- None
- Course number
- 26c01461
CPE Today (Devmatics, LLC) is registered with the National Association of State Boards of Accountancy (NASBA) as a sponsor of continuing professional education on the National Registry of CPE Sponsors (Sponsor ID 167619). State boards of accountancy have final authority on the acceptance of individual courses for CPE credit. Complaints regarding registered sponsors may be submitted to the National Registry of CPE Sponsors through its website, nasbaregistry.org. For information about our refund, complaint, and program cancellation policies, see Company Policies or contact [email protected].
💬 Ask this course
Not sure it covers what you need? Ask a real question — answered from the actual course content, so you can decide before you enroll.
Reading the course…
Answers come from this course's own material and can be imperfect — the full details are in the course itself.
Every way to take this course
Live Replay Webinar
Start it whenever you like — full live CPE credit · How Live Replay works · 3 credits
$85
Add to Cart
Your instructor

Stephen Yoss
Speaker & Author · CPE Today · ★ 4.7 instructor rating
Stephen M. Yoss, Jr., CPA, MS, is a certified public accountant, partner and CEO of Devmatics, LLC, a continuing education instructor for financial professionals, and a licensed pyrotechnician. While his interests and skills are varied, they all share a common thread—his love for and skill in finding technology-based solutions. In 2017, Stephen and Alex White formed Devmatics, LLC, a company focused on helping...
Full profile →Common questions
Will I be able to actually do regression analysis and forecasting in Excel, or will I need specialized statistical software?
Excel has everything you need built in. I completed my entire master's degree using Excel for quantitative analysis and regression work. The Analysis ToolPak gives you regression testing, correlation analysis, and forecasting functions like Forecast ETS that produce professional results—you saw me run a regression on advertising spend versus sales revenue and get an R-squared value showing their relationship. For most business analytics, Excel handles the heavy lifting; specialized tools like SPSS are only necessary if you're doing raw data research for NIH grants or clinical trials.
I'm not a statistics expert—will I understand what these tools actually mean or what to do with the results?
The beauty of Excel is that most of the math is abstracted out. You don't need to know the underlying formulas; the software does the work. When we ran descriptive statistics, you get your mean, median, standard deviation all in one output. With regression, the key takeaway is simple: an R-squared of 0.55 means correlation but not strongly, while 0.95 means they move together tightly. I show you what each number means in plain business language—like how every dollar of advertising gave us $4.34 in sales—so you can make decisions with the results, not just generate them.
Can I actually use this for real decisions my company makes, like forecasting revenue or figuring out our product mix?
Absolutely—I demonstrated Goal Seek to show how much you need to sell to hit $150,000 profit, and Solver to optimize product mix when you have constraints like factory capacity. These aren't theoretical exercises; they answer real questions like "if we expand our warehouse, how much more can we produce profitably?" or "which combination of products maximizes profit given our staffing limits?" You're replacing manual guessing with mathematical optimization that leadership can actually use in board meetings.
I have a specific problem in my firm—like understanding why advertising isn't driving enough sales, or planning for different growth scenarios. Can this course help me solve that?
Yes. I walked through exactly that example: testing whether advertising spend actually impacts revenue using regression analysis from the Analysis ToolPak, and showed the result was 0.55 correlation—suggesting the money might not be spent effectively. Then I showed Scenario Manager and Solver so you can model "what if we shift the budget to digital" and solve for the best outcome. The course gives you the specific tools (regression for diagnosis, Solver for optimization) to answer these kinds of business questions.
Is this just about formulas and charts, or do you actually show how to think about data and ask the right questions?
Both—that's the core philosophy. I spent significant time early on explaining that statistics alone mislead: averages hide outliers, high order values mask flat customer growth, and stable monthly numbers hide underlying risk. I showed you how to use a hypothesis going in and apply the scientific method. I demonstrated how to stratify data—instead of one average, break it into bands to see the real patterns. The technical skills are only useful if you know what questions to ask and how to interpret what the numbers actually tell you about your business.
Related reading from our instructors
You might also like
Conference
 Seminar
 Seminar
Happening now
 Seminar