


 Conference
Live Replay WebinarIntermediate level
The How's And Why's Of Data Analytics
★★★★☆
4.0 · 3 attendee ratings
Increasingly, accountants and auditors are called upon to use data analytics to understand and improve results. Yet, many professionals struggle with the concept of data analytics and remain unaware of how to obtain the results needed using tools they already own. In this session, you will learn about the four primary types of data analytics and when to use each. Further, you will learn how to generate meaningful analytical measurements using Excel, Power BI, and other tools and, more importantly, how to interpret the results. If you seek to use data analytics – and who isn't – this session is for you.
Ways to save
Save $44.56 with a credit pass
At the 40-Credit Pass rate ($22.22 a credit with the bonus), this 2-credit course comes to about $44.44: $44.56 less than buying it on its own.
Or start smaller: the 10-Credit Pass ($275.00) pays for it and leaves you 8 credits for more.
Year-end bonus: up to 5 free credits through Dec 31.
Certain conditions apply: not valid for the Federal Tax Update. Pass terms
Watch
 2:23
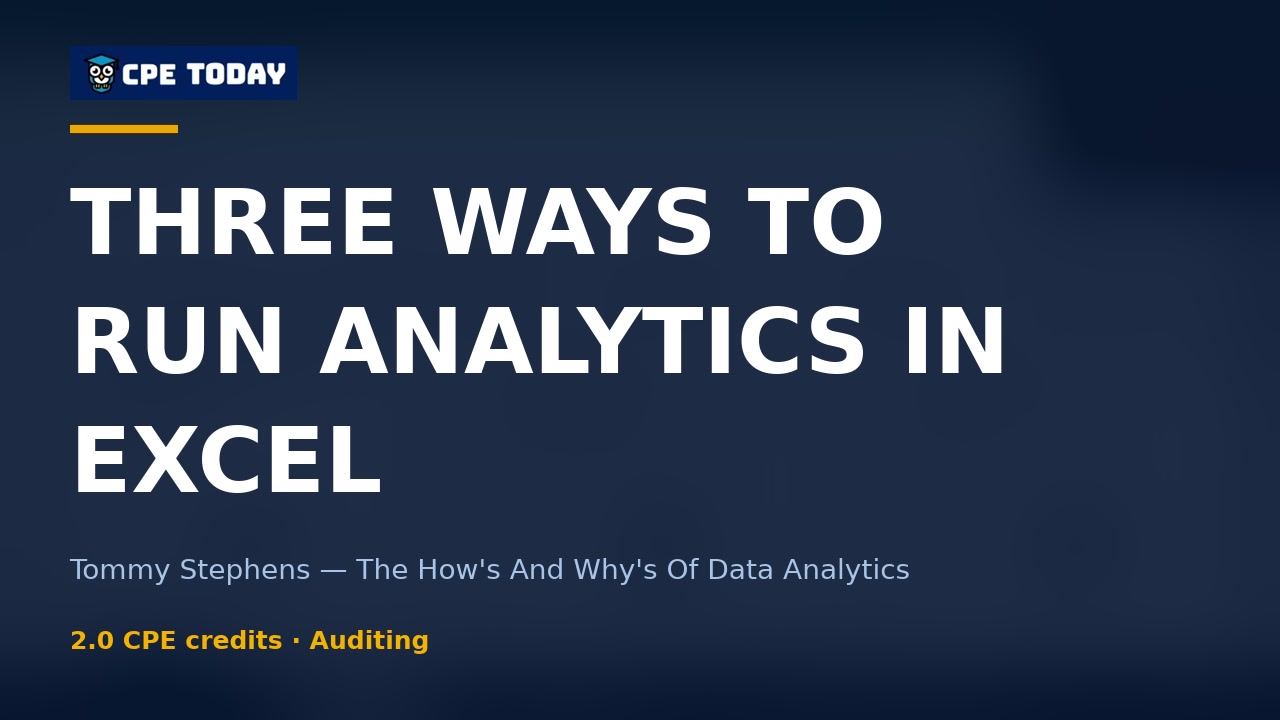
Three ways to run analytics in Excel—plus free toolsTommy Stephens walks through activating Excel's Analysis Tool Pack—a powerful built-in feature that generates detailed statistical analysis without writing code. Learn how to enable this tool, configure your default file locations, and start running descriptive statistics on your data. Watch to see the step-by-step process and discover how Python in Excel and Copilot can extend your analytics capabilities even further.
 3:52
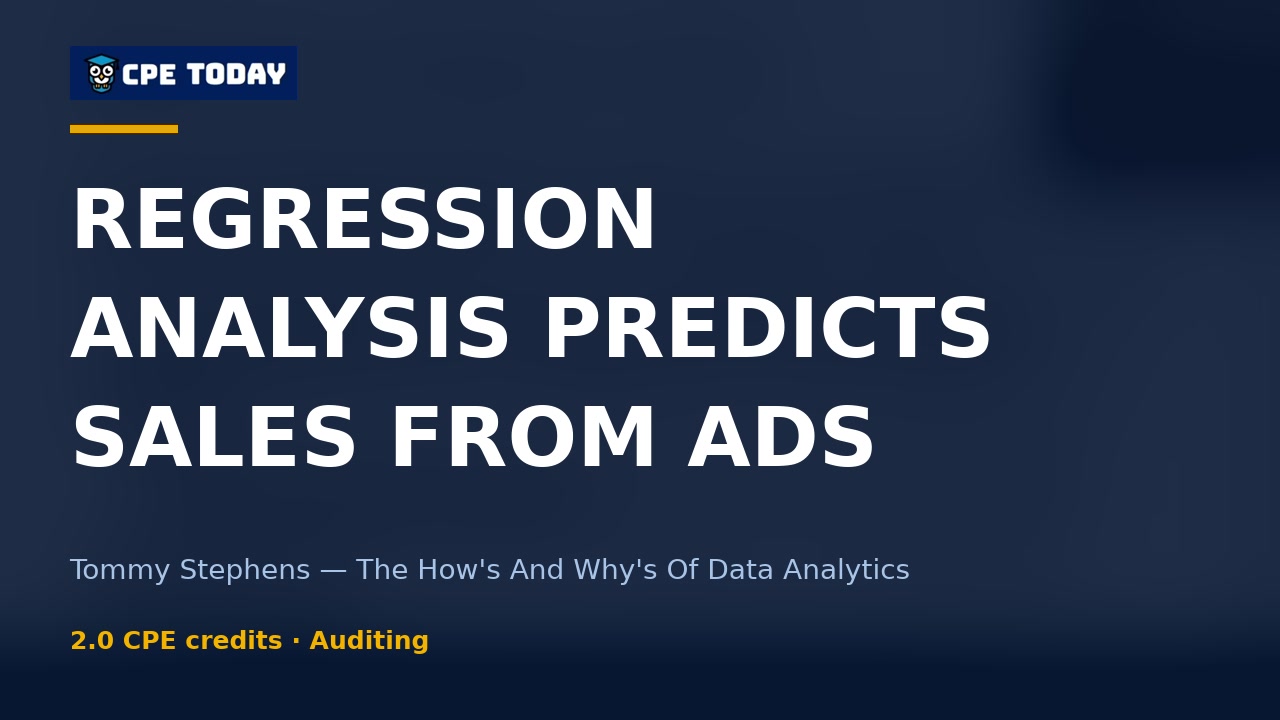
How Regression Analysis Predicts Sales From Ad SpendTommy Stephens walks through building a regression model to identify which variables drive your results. See how to interpret r-squared values, set up dependent and independent variables, and use your regression equation to forecast outcomes—like predicting sales from advertising spend. This is essential data analytics work that goes beyond intuition.
 1:27
Why Fraudsters Avoid the Number 1Fraudsters deliberately structure transactions to evade compliance thresholds—and it leaves a statistical signature. Learn how approval limits, reporting requirements, and regulatory hurdles create predictable patterns that data analysis can expose. Watch how Tommy Stephens reveals the hidden clues in transaction numbers that separate legitimate business from fraud schemes.
 2:17
The Status Bar Superpower for Instant Meeting AnswersWhen you're presenting to a room full of people and someone asks for instant statistics on a data range, most analysts freeze. Tommy Stephens reveals the status bar trick that gives you average, sum, min, max, and count in seconds—no formulas needed. Watch how to activate it and use it to look like a data wizard in your next meeting.
What's included
Every registration comes with the course materials — yours to keep.
- Course handout PDF
- Course video MP4
- Additional course files PDF, ZIP
Course details
- Recommended CPE credit
- 2
- Field of study
- Auditing
- Program level
- Intermediate
- Delivery method
- Group Internet Based
- Prerequisites
- None
- Advance preparation
- None
- Course number
- 22c-hwda
CPE Today (Devmatics, LLC) is registered with the National Association of State Boards of Accountancy (NASBA) as a sponsor of continuing professional education on the National Registry of CPE Sponsors (Sponsor ID 167619). State boards of accountancy have final authority on the acceptance of individual courses for CPE credit. Complaints regarding registered sponsors may be submitted to the National Registry of CPE Sponsors through its website, nasbaregistry.org. For information about our refund, complaint, and program cancellation policies, see Company Policies or contact [email protected].
💬 Ask this course
Not sure it covers what you need? Ask a real question — answered from the actual course content, so you can decide before you enroll.
Reading the course…
Answers come from this course's own material and can be imperfect — the full details are in the course itself.
Your instructor

Tommy Stephens
Partner · K2 Enterprises · ★ 4.6 instructor rating
Tommy Stephens received a Bachelor of Science in Business Administration degree (Major in Accounting) from Auburn University in 1985. In 1992, he earned a Master of Science degree (Major in Finance) from Georgia State University in Atlanta. Presently, Tommy is a Certified Public Accountant, a Certified Information Technology Professional, and a Chartered Global Management Accountant. In 1995, Tommy began...
Full profile →Attendee feedback
4.0
3 attendee ratings
Common questions
I'm an accountant, not a data analyst—is this course really for me?
Absolutely. Your accounting background is actually invaluable here. You already understand reconciliation, accruals, the importance of balances tying between systems, and why basis of calculation matters—skills most salespeople and non-accountants lack entirely. The course positions you as a 'digital plumber' who can identify where data flows should match but don't, making you essential to analytics work that others simply cannot do well.
Do I need any special software or licenses to follow along with the demos?
No. You already have what you need if you have Microsoft Excel and Office. The Analysis ToolPak and Analyze Data features are built into Excel at no extra cost—you just activate them in Add-Ins. Power BI is also demonstrated, but the core analytics techniques work in Excel alone. The course includes data files you can download to practice with.
Will this teach me to actually *do* analytics, or just theory?
This is hands-on. You'll activate Excel's Analysis ToolPak, run descriptive statistics, build histograms, perform regression analysis with real order data, use Benford's Law to spot anomalies, and see how to query datasets by typing questions in natural language. The instructor walks through live Excel demonstrations including formulas, pivot analysis, and how to read regression output to build a predictive sales model.
I work with small datasets and simple spreadsheets—will the advanced tools here overwhelm me or actually help?
The course starts with what you already use in Excel and builds up logically. Whether you're analyzing a few hundred rows or millions, the same techniques apply. The instructor emphasizes that Benford's Law works better on large datasets, for example, and shows you how to spot when a tool is the right fit. You'll learn when to use a simple average from the status bar in a meeting versus when you need regression analysis.
After this course, will I actually be able to use analytics to make better business decisions, or will I just understand the concept?
You'll be able to do both. The course covers the four analytics questions—what happened, why it happened, what will happen, and how to improve—with concrete examples: restaurant staffing around game days, inventory management for products that sell versus don't, and using regression to forecast sales based on advertising spend. You'll leave with formulas and techniques you can apply Monday morning.
Related reading from our instructors
You might also like
Conference

K2’s Ripped From The Headlines: Lessons Learned From The Most Interesting Tech Crimes
Auditing
★★★★★
4.6 (58)
$55 · Live Replay
Live dates from $800/day


K2's Small Business Internal Controls, Security, and Fraud Prevention and Detection
Auditing
★★★★★
4.7 (22)
At live events