CPE Today Logo

K2’s Excel Charting and Visualizations

Course - K2's Ten “Must Know” Features In Excel

Upcoming Live Event Schedule

This course is part of an event and you must register for the associated event to participate.

Mastering Microsoft and Fraud Controls: Multi-state Conference
July 16, 2024 | Seminar

Unlock the Power of Excel & Microsoft 365 Multi-State Conference
December 16, 2024 | Seminar

Major Topics

  • Understanding the best types of visualizations to use in specific situations
  • Creating compelling visualizations using Excel
  • Adding interactivity to your Excel-based visualizations

Learning Objectives

  1. Identify the types of visualizations that you should use to communicate specific messages
  2. List the steps to creating compelling visualizations in Excel and other Microsoft Office applications
  3. Identify options for creating interactive visualizations
  4. Utilize Sparklines and Conditional Formatting to enhance visualizations in Excel
  5. Identify options for linking Excel-based data and visualizations into Word and PowerPoint

Course Description

Charts and graphs are nothing new. However, many professionals struggle with building compelling visualizations. If that statement describes you, participate in this session to improve your skills in creating Excel charts and other visualizations. As a result, you will create visualizations to enhance your communication skills.

This session is much more than just a seminar on fundamental charts. Instead, in this session, you will learn how to create advanced charts that are interactive, dynamic, and aesthetically pleasing – three qualities that will help to ensure that your readers and audience will understand the data you are presenting. This seminar is a must if you want to improve your communication skills.

Compliance Information

Intended Audience

CPAs and other accounting, financial, and business professionals who want to learn how to create more effective charts and visualizations in Excel

Advanced Preparation

None

Field of Study

Computer Software and Applications

Credits

4 Credits

Published Date

November 2, 2022

Course Authors

K2 Enterprises

Hammond, LA
Various Speaker, Company Tagline

K2’s goal is to produce and deliver the highest quality technology seminars and conferences available to business professionals. We work cooperatively with professional organizations (such as state CPA societies and associations of Chartered Accountants) and vendors of technology products. K2 also provides consulting services and advice on technology.

We make every effort to maintain a high level of integrity, family values, and friendship among all involved.

About Instructor Read Less

Overview

Charts and graphs are nothing new. However, many professionals struggle with building compelling visualizations. If that statement describes you, participate in this session to improve your skills in creating Excel charts and other visualizations. As a result, you will create visualizations to enhance your communication skills.

This session is much more than just a seminar on fundamental charts. Instead, in this session, you will learn how to create advanced charts that are interactive, dynamic, and aesthetically pleasing – three qualities that will help to ensure that your readers and audience will understand the data you are presenting. This seminar is a must if you want to improve your communication skills.

Course Details

  • Understanding the best types of visualizations to use in specific situations
  • Creating compelling visualizations using Excel
  • Adding interactivity to your Excel-based visualizations

  1. Identify the types of visualizations that you should use to communicate specific messages
  2. List the steps to creating compelling visualizations in Excel and other Microsoft Office applications
  3. Identify options for creating interactive visualizations
  4. Utilize Sparklines and Conditional Formatting to enhance visualizations in Excel
  5. Identify options for linking Excel-based data and visualizations into Word and PowerPoint

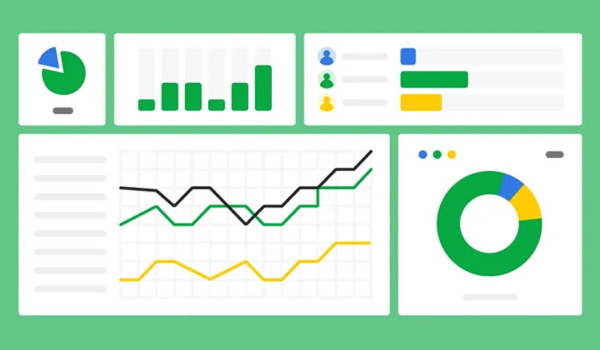
Intended Audience — CPAs and other accounting, financial, and business professionals who want to learn how to create more effective charts and visualizations in Excel

Advanced Preparation — None

Field of Study — Computer Software and Applications

Credits — 4 Credits

IRS Program Number

Published Date – November 2, 2022

Revision Date

Course Authors

K2 Enterprises

Hammond, LA
Various Speaker, Company Tagline

K2’s goal is to produce and deliver the highest quality technology seminars and conferences available to business professionals. We work cooperatively with professional organizations (such as state CPA societies and associations of Chartered Accountants) and vendors of technology products. K2 also provides consulting services and advice on technology.

We make every effort to maintain a high level of integrity, family values, and friendship among all involved.

About Instructor Read Less

All of our self-study courses are NASBA approved (through our partners at K2 Enterprises) the revisions to the Statement on Standards for Continuing Professional Education (CPE) Programs (Standards).

Your Registration Includes:

  • Course materials (video & PDF version)
  • Unlimited attempts to complete exam
  • Course materials (PDF & Sample Materials)
  • Instant grading & certificate of completion
  • One year access to complete your CPE
  • Completion certificate

Recommended Products

Courses and Events You’ll Love!